Question
Tự luận
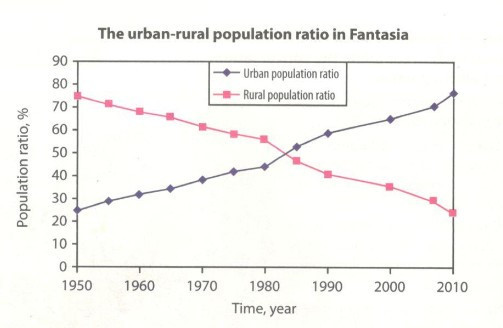
1. (Trang 17 - Tiếng Anh 12): Look at the line graph and answer the following questions.
(Xem biểu đồ đường và trả lời các câu hỏi dưới đây)
1. What does the graph show?
2. What information is shown on the vertical axis?
3. What information is shown on the horizontal axis?
4. What patterns can you see?
5. What comparisons can you make?
Bài làm:
Read more: SBT Tiếng Anh 12 mới Unit 2: Writing trang 17
Verified Answer
1. What does the graph show?
=> It shows the urban-rural population ratio in Fantasia from 1950 to 2010.
(Biểu đồ cho thấy gì?
=> Nó cho thấy tỷ lệ dân số đô thị và nông thôn ở Fantasia 1950-2010.)
2. What information is shown on the vertical axis?
=> The population ratio in percentage.
(Thông tin gì được thể hiện trên trục tung?
=> Tỷ lệ dân số theo phần trăm.)
3. What information is shown on the horizontal axis?
=> The 60-year period from 1950 to 2010 (divided by ten-year intervals).
(Thông tin gì được thể hiện trên trục hoành?
=> Giai đoạn 60 năm 1950-2010 (chia khoảng thời gian mười năm).)
4. What patterns can you see?
=> The urban population ratio increased, and the rural population ratio decreased.
(Bạn có thể thấy đường hướng diễn ra nào?
=> Tỷ lệ dân số đô thị tăng lên, và tỷ lệ dân số nông thôn giảm.)
5. What comparisons can you make?
=> The differences between the two patterns.
(Những so sánh nào bạn có thể thực hiện?
=> Sự khác biệt giữa hai mô hình.)