Question
Tự luận
3. (Trang 17 - Tiếng Anh 12): Write a description (of 130-150 words) of the trends in the graph.
(Viết đoạn mô tả (130-150 từ) về các xu hướng trên biểu đồ.)
Bài làm:
Read more: SBT Tiếng Anh 12 mới Unit 2: Writing trang 17
Verified Answer
Gợi ý:
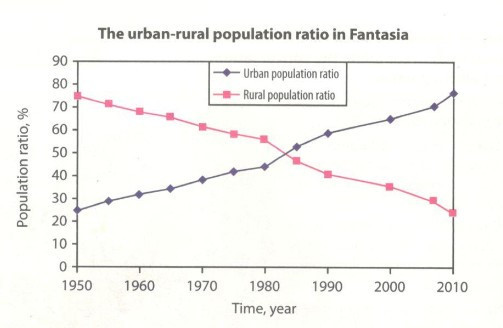
The line graph illustrates the ratio between urban and rural population in Fantasia over a 60-year period from 1950 to 2010. Overall, the ratio of urban population went up continuously, while the rural population ratio experienced a steady fall.
In 1950,75% of the population lived in rural areas compared to only 25% of urban dwellers at the time. The next 30-year period saw some changes in the trend with more people (around 45%) living in urban areas and fewer people (less than 60%) living in rural areas.
Towards the end of the period, the trend was totally reversed. In 2010, around 75% of the population lived in urban areas, whereas just merely 25% still lived in rural areas.
In summary, as time went by, more and more people chose the city over rural areas to settle down.
Hướng dẫn dịch:
Biểu đồ minh họa tỷ lệ giữa số dân đô thị và nông thôn ở Fantasia trong khoảng thời gian 60 năm từ năm 1950 đến năm 2010. Nhìn chung, tỷ lệ dân số đô thị đã tăng liên tục, trong khi tỷ lệ dân cư nông thôn đã giảm ở mức ổn định.
Năm 1950,75% dân số sống ở khu vực nông thôn so với chỉ 25% của cư dân đô thị vào thời điểm đó. khoảng thời gian 30 năm sau đã thấy một số thay đổi trong xu hướng với nhiều người hơn (khoảng 45%) sống ở khu vực đô thị và ít người hơn (dưới 60%) sống ở khu vực nông thôn.
Đến cuối giai đoạn này, xu hướng đã hoàn toàn đảo ngược. Trong năm 2010, khoảng 75% dân số sống ở khu vực đô thị, trong khi đó chỉ đơn thuần 25% vẫn còn sinh sống ở các khu vực nông thôn.Tóm lại, khi thời gian trôi qua, ngày càng có nhiều người chọn thành phố hơn là khu vực nông thôn để định cư.